The Trouble With _time: Better Splunk Search Scheduling with _index_earliest
You’ve lovingly crafted a new, bespoke Splunk search. How do you schedule it?
“Well, that’s easy," replies my fictionalised reader. “You just make sure your search time range matches the schedule frequency, and you’re good to go."
And that would be simple, wouldn’t it?
“But there’s almost a law of the universe that solutions which are:
the first thing you’d think of, and
look sensible, and
are easy to implement, are often
terrible, ineffective solutions, once implemented will drag on civilization forever."
Okay, that’s a little dramatic for this topic, but the point stands - this situation can be improved with a little bit of effort and planning.
The Issue with Naivety
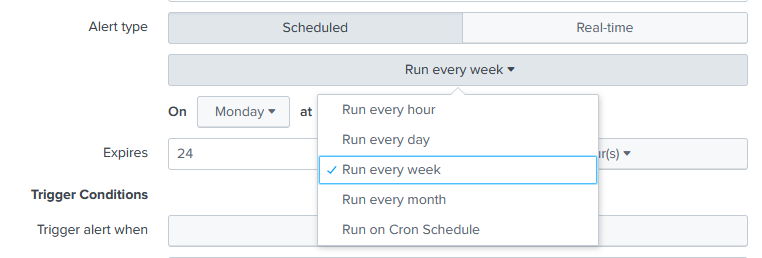
Say you have a simple alert - pick up all events in the last 15 minutes - and you choose earliest=-15min latest=now and give it a cron of */15 * * * *. Where is the issue here? Well, the problem comes down to using earliest and latest - these work on event time.
You’re likely familiar with _time when working with Splunk events. This is a parsed, standardised timestamp across every event that records when an event occured. Its value may be pulled out of the raw log, or be inferred from when Splunk first recieved it, but its format is always the same - it’s presented to you in a human-readable format in the UI, but under the hood it is always a Unix epoch, an integer - you can see it if you use rename _time as time to observe the underlying value without window dressing.
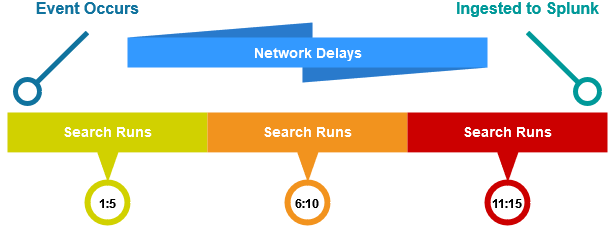
But what happens if we’re collecting AV or EDR events from a host? We have no reliability or assurances on the network conditions from an in-the-field OS agent to eventually reach our SIEM. For example, say a user executes a malicious script while travelling on a plane: your SOC won’t be aware of it until they next connect to the Internet to report it. In this situation, the above naive search would actually miss this event entirely.
Ingestion delays and network latency can cause events to miss their original search window.
How Do We Fix It?
A better solution is to schedule our search based on what events are new in Splunk in the last interval. And luckily, Splunk has another built-in field to do this, just like with _time, called _indextime. But, like with _time, the UI has some special rules that don’t let you see it - rename _indextime as indextime will let you see the value natively.
Similarly to the earliest and latest used in our scheduling earlier, Splunk has another option for setting the time range filters on an alert: _index_earliest and _index_latest. So, reformatting our original query to use earliest=-1d latest=now _index_earliest=-15m@m _index_latest=@m will pick up on the events our naive filter would have let slip through.
In the above diagram, each search window is no longer looking for the ‘Event Occurs’ time, but instead the ‘Ingested to Splunk’ time. This guarantees every event will be processed eventually, even with significant issues in the data processing pipeline.
There’s a few other cool uses for _indextime too. For example, you can easily compare the two integers to assess your log ingestion delay, and even average this to get a good feel for what’s normal in your indexes:
| rename _indextime as indextime, _time as time
| eval diff_mins = round((indextime - time) / 60, 2)
| table time, indextime, diff_mins
Hopefully this has been useful in showing where you can add some simple reliability and assurance to improve your spelunking.