A TRMNL Plugin for Bouldering Gyms
Jun. 17, 2025How busy is the climbing gym tonight?
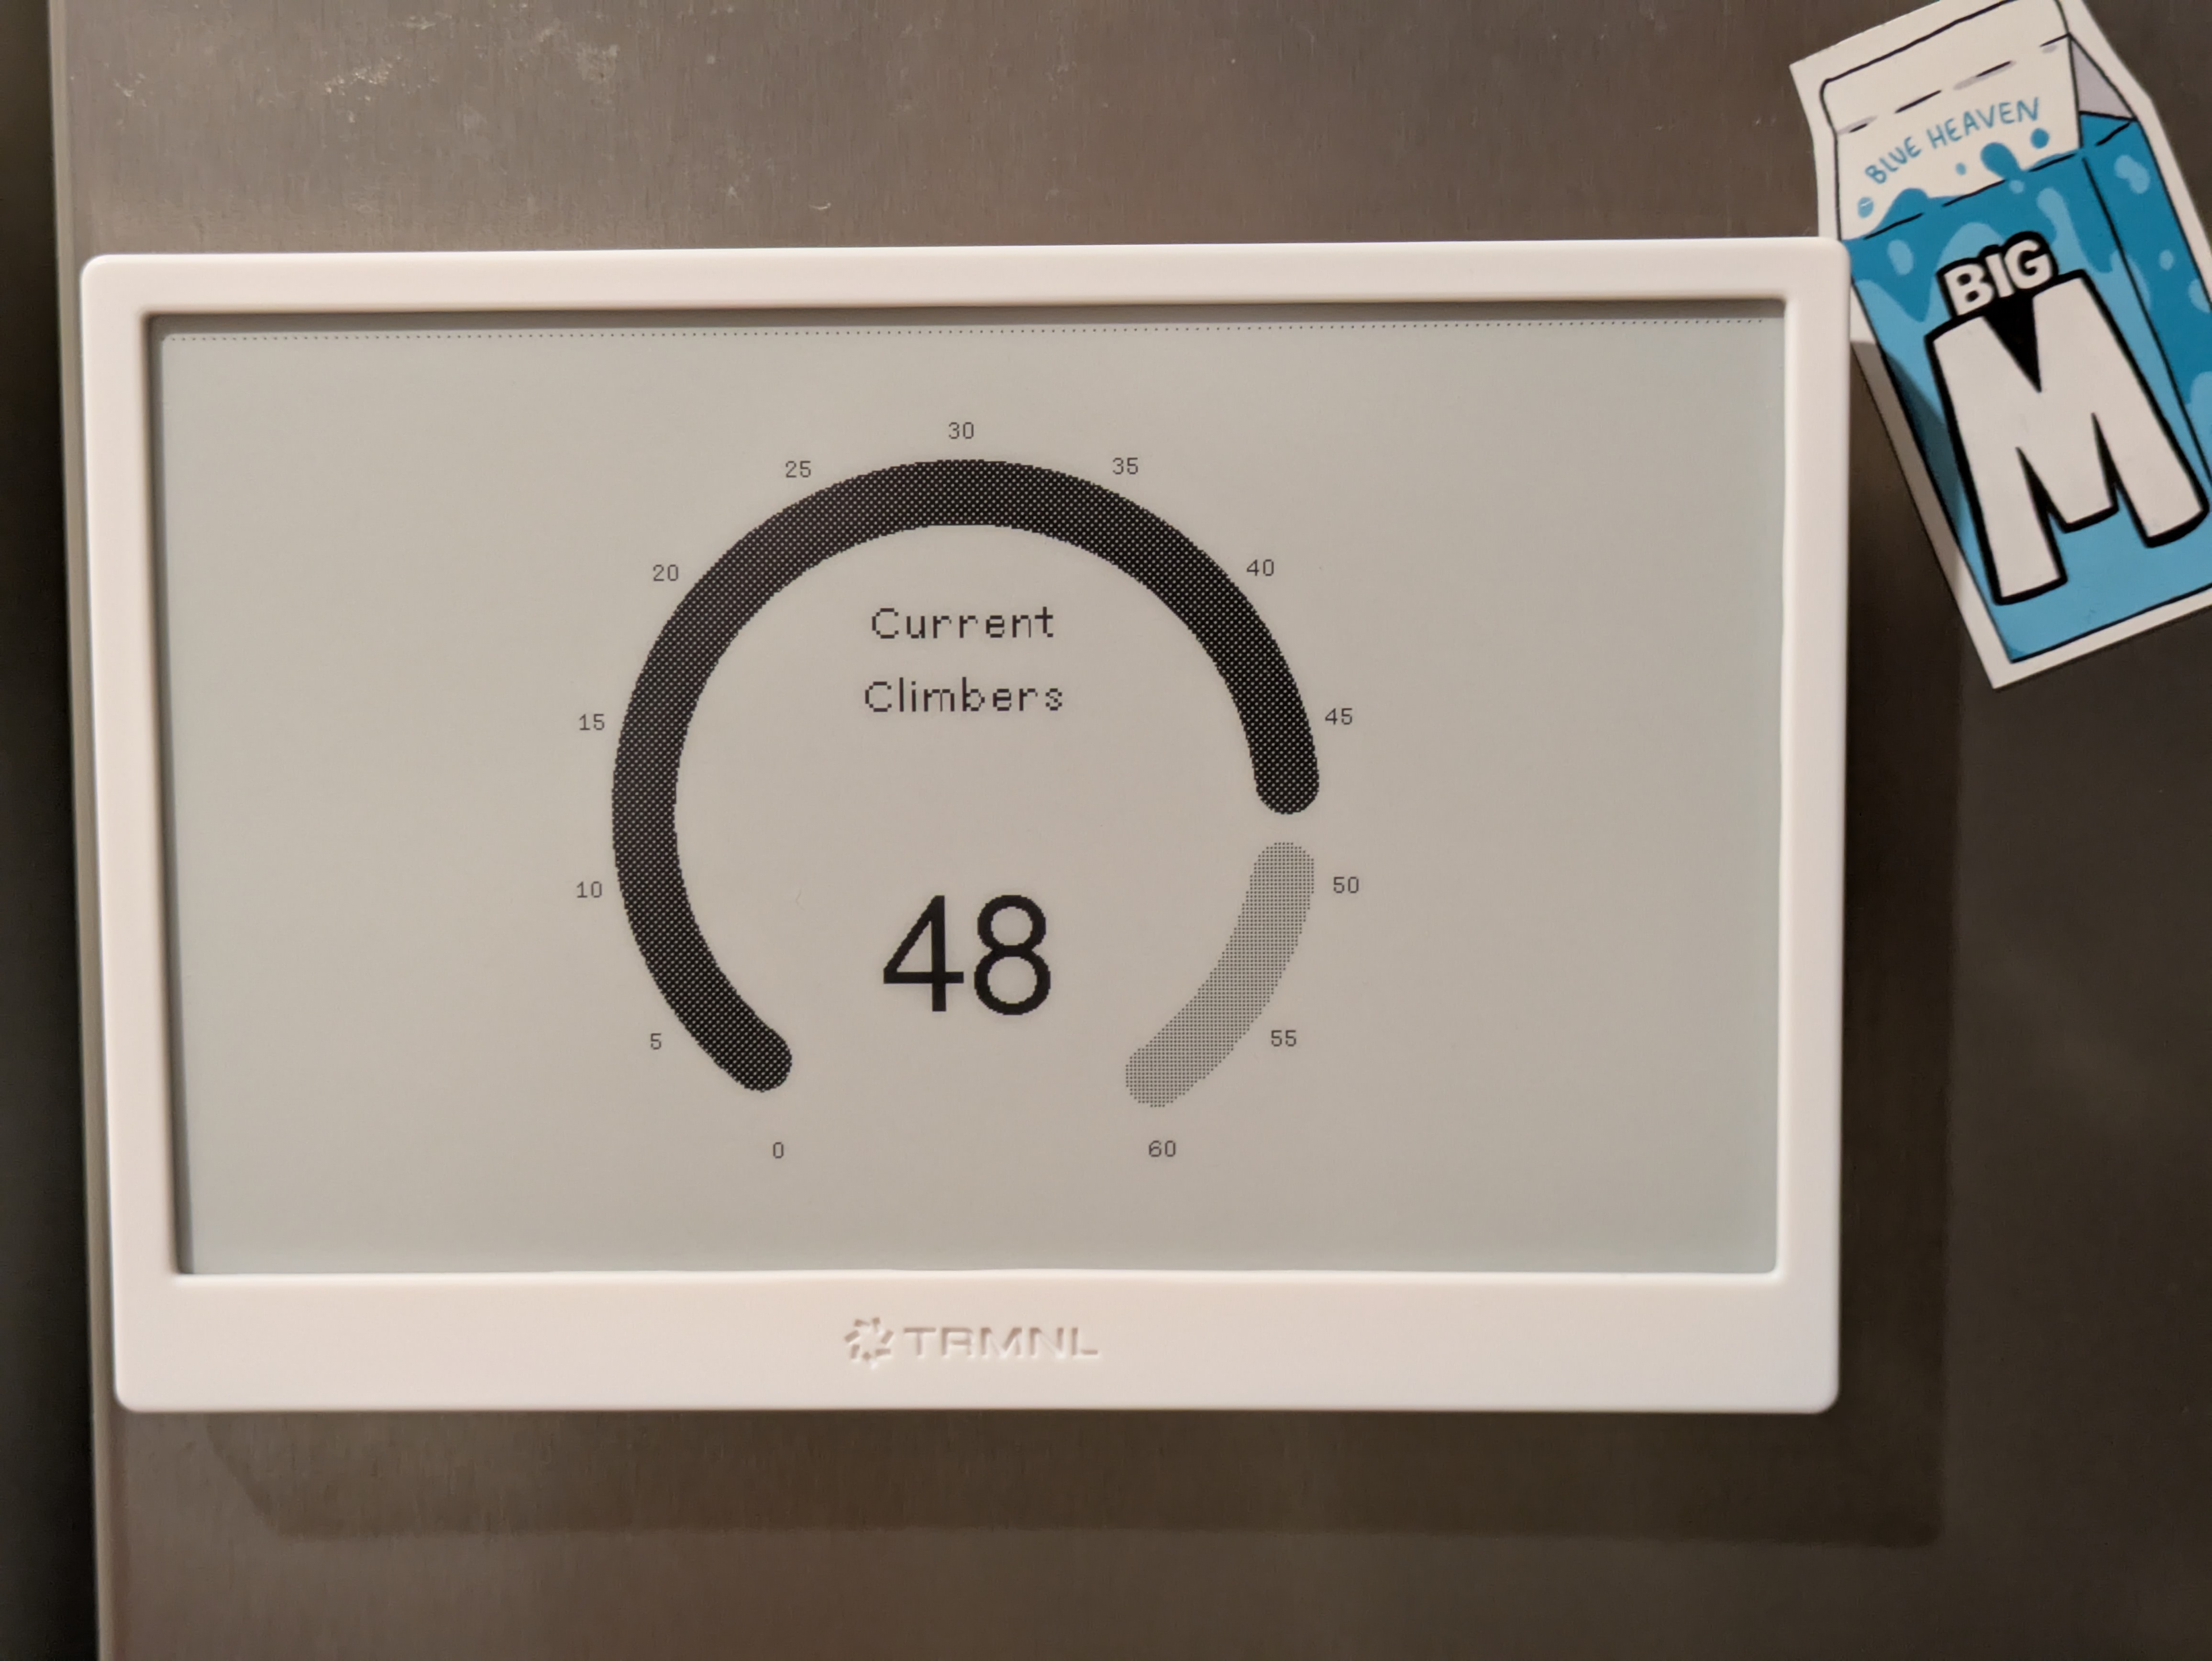
I recently got a new toy to play with, a TRMNL e-ink display for passive information. It’s pretty hacker-friendly and you can build your own plugins to connect to any system you want and build the display system with HTML templates.
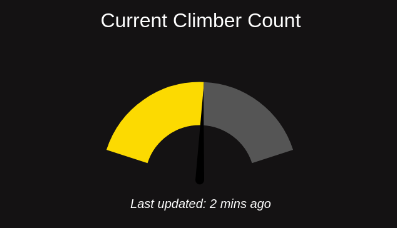
In my case, I wanted something to show how busy my local climbing gym is so I can pick a good time to go. They use RockGymPro for their POS system, which happens to have a publicly-accessible URL for an iframe which will generate a Javascript gauge chart.
That’s almost exactly what I want to show on my fridge, but TRMNL has their own design framework of widget components which blend nicely together and are optimised for the e-ink screen. The goal of this project is to scrape this public data and slot it into the pretty HTML templates that the TRMNL uses.
Prior Art
eiri on Github has an existing Go project which does this scraping as part of a Telegram bot, so I took some inspiration from there. Their work is significantly better than mine, actually parsing the data the hard and correct way, so I’d recommend using that project if it fits your needs.
Scraping
There are two options for fetching data with TRMNL plugins: polling, where TRMNL reaches out to some API endpoint; or webhook, where you send data to the TRMNL server. You can either push or pull, and in my use case I think it makes more sense to use polling since the iframe is already public.
In theory, I could do all the scraping bits I need to in the same JavaScript that runs to generate the chart, but then I’d be writing more JavaScript than I have to which makes everyone sad. If only this iframe just had a nice JSON API!
What we could do is run a webserver that handled the scraping for us, but then I’d have a whole other server to manage when all it really needs to do is run one tiny script. This is the ideal use case for Functions as a Service, like AWS Lambda. These are all pretty interchangeable for something this simple, so I went with Cloudflare Workers to learn something new, but any of the major cloud provider’s implementations would do. We should end up with something like this:

Cloudflare Workers supports multiple languages, so I opted for Rust for this project. It’s only 150 lines or so, the gist of which is:
- Validate the GET / POST request supplied a gym ID to use
- Fetch the HTML of the public
iframeas plain text - Regex out the part of the script which defines the numbers we care about, ‘current count’ and ‘capacity’.
- Format the data into a struct and return it as a nice JSON object
JavaScript to JSON
One snag I hit during this process is that what we’re parsing out of the html text is not itself JSON, it’s a Javascript object declaration, like this:
var data = {
'AAA' : {
'capacity' : 60,
'count' : 31,
'subLabel' : 'Current Climber Count',
'lastUpdate' : 'Last updated: 7 mins ago'
},
};
I went down a bit of a rabbit hole trying to reliably convert this into valid JSON that Serde would accept, with character replacements and regexes to remove trailing commas, until I found the much more permissive json5 crate, which allows a superset of JSON that includes single quotes and trailing commas. That avoided this headache entirely, since this JavaScript code is already valid json5 and natively parsable.
Charting the Way
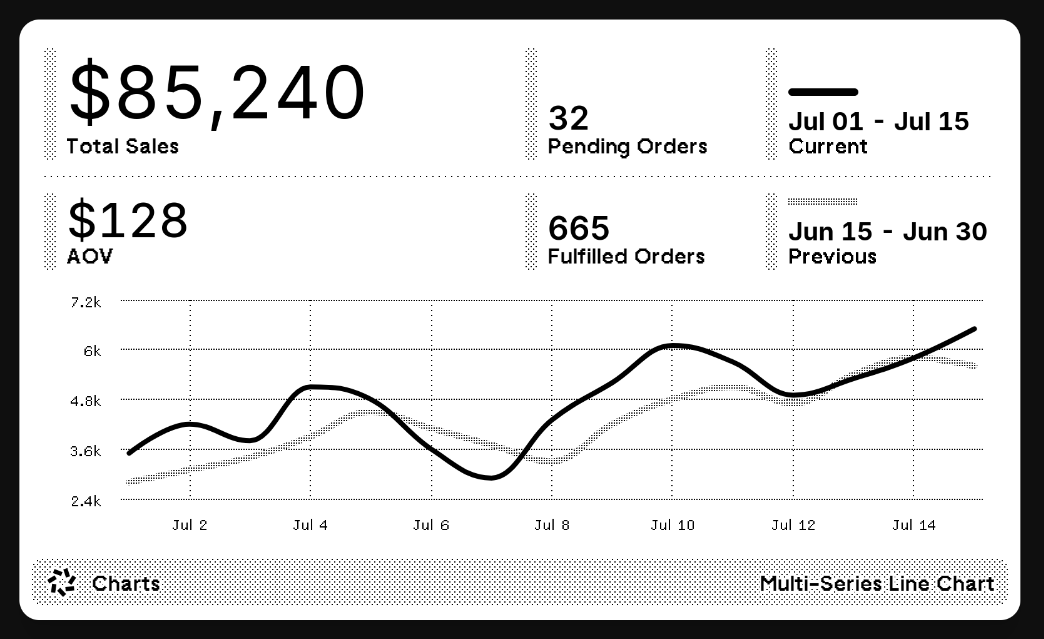
Now we have a public URL we can hit with a gym_id and get clean JSON back. All that’s left is to write the HTML templates which generate the pretty charts. TRMNL’s framework docs already include a full example of a Gauge chart, so I slightly modified that to a bare-bones version with just a single chart in the middle. I’m not much of a UI designer so my templates look a little plain, but it was good enough for me to wrap the project up there.
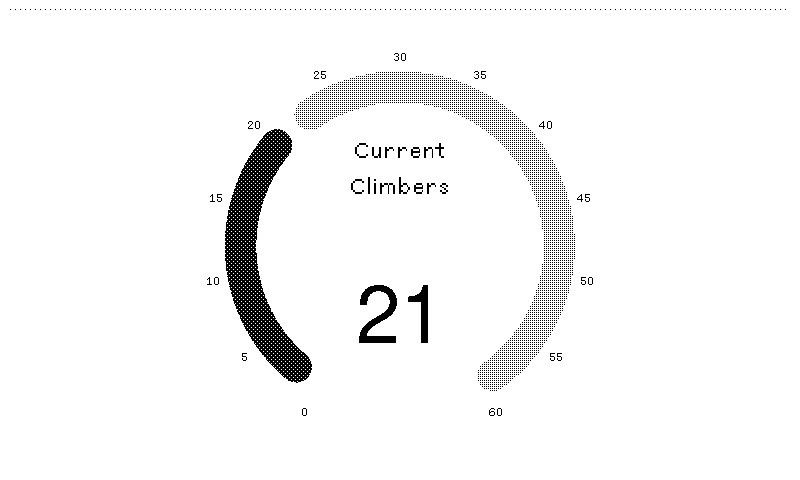
looks quiet, good time to go!
The code for the Rust Worker and the HTML templates is available here if you want to peruse, or it’s available as a Community Recipe for installation on your TRMNL here.