Splunk is a Game Engine, Actually
Maybe you’ve used Splunk day-to-day before, but have you ever really abused it?
The Joy of Subverting Design
Have you ever seen those conference presentations on YouTube about how PowerPoint is Turing Complete (as is Magic the Gathering), you can encode images in a spreadsheet, or investigated esoteric programming languages? Watching a person dive so deep down a rabbit hole that they utterly mutate how a thing is supposed to be used brings me a strange satisfaction. As the saying goes, you’ve got to know when to commit to the bit, and it’s one of my favourite forms of niche comedy; doing a thing for no other reason than to prove it can be done, with quite literally no practical purpose behind it.
And, well, I’ve run into some really weird corners of SPL. You accumulate so many tricks that eventually, one day, a thought struck me: you could build a game inside all this. My goal here is not just to prove this can be done, but also to hopefully introduce to you some niche features in SPL and dashboarding that you may not have heard about.
Let me also give a disclaimer out front: as great as the newer Dashboard Studio is, there are still some things you can do in XML that haven’t been migrated over yet, so we’ll still be in the old-school days for this project.
The MVG (Minimal Viable Game) Components
What do we need to achieve this? At least in my definition, the key components you’d need to call something a “game” are:
- User input. While there are technically some zero-player games, they still involve some way to set an initial state; otherwise, you’re just watching a movie. So, if I ask how to take an input in Splunk, hopefully your mind is jumping to dashboards. You can have direct input methods like text boxes or dropdowns, but critically also handlers for on-click events, which starts to sound like an actual web app.
<drilldown>
  <set token="user_input">$click.value2$</set>
</drilldown>
- Memory. There’s two concepts we’ll utilise here. The first is how to store the game state, or the position of the ‘board’, which we can just write out to a CSV file and read back from; essentially traditional disk access. But the other solution, for meta-game tracking like the current active mode or the score, we can do with dashboard tokens. These are a sort of variable that are persistent to each session, and can be overwritten or compared within our code.
| inputlookup game_state.csv
| eval user_input = $user_input|s$
- A game loop. Most implementations of even simple games have a core game loop to consider, or a tick rate. Process physics. Render models. Draw graphics. Repeat. This is, in my opinion, perhaps one of the hardest aspects to achieve within Splunk. You could run a scheduled search, but they have a minimum cron interval of a minute, which would result in a pretty atrocious ~0.0167 framerate. However, since we’re running this on a dashboard, you can actually refresh a panel at the blazingly-fast rate of once per second – albeit with a deprecated method.
<option name="refresh.auto.interval">$game_speed$</option>
- Changing states. Finally, some sort of state transition would be nice, so we can reset and initialise the game, and present a ‘game over’ screen if you lose. For that, we need to stop the game loop and display a static version of it. The trouble is, you can’t really change the code running a dashboard panel, since SPL doesn’t really have the concept of conditional execution. The trick here is that, while you may not be able to change a single panel, you can hide and show panels dynamically through setting and unsetting tokens, essentially hotswapping in a ‘mirror’ of the original to show different content in the same spot.
<table depends="$game_over$">
What Game are we Making?
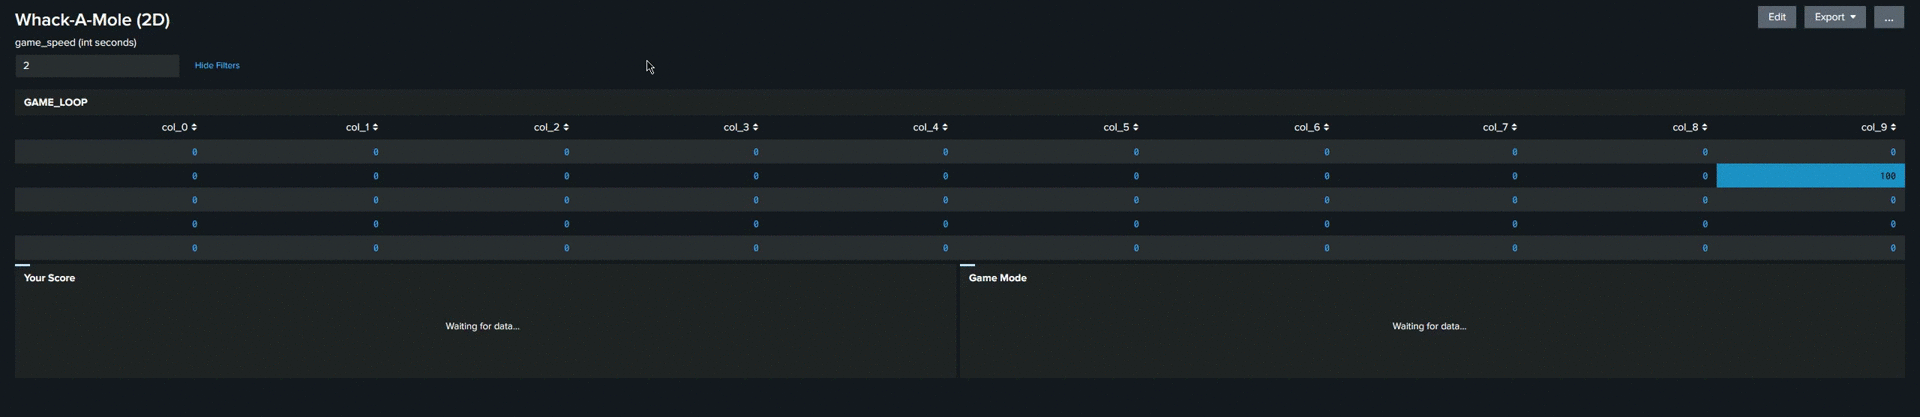
My first thought when I came up with this idea was to build something like Pong, but I quickly realised that we should K.I.S.S. and stick with someone one-dimensional for now instead. This is a bit like the recent trend from multiple people to create games and animations in the URL bar of the browser, where you’re limited to a 1-D array of characters to represent your game world, like a Turing machine’s tape. One option from that would be something like Whack-a-Mole. Light up a random cell, swap them quickly, and you get points for every correct hit. Game over is any misclick on a ‘dark’ cell.
Initially, I did this with a simple back-and-forth to make it predictable. The internal state would store a direction variable, and just progress from one cell to the next until it hit the end, at which point the direction would be flipped and the process starts again.
| eval direction = case(
    direction == "right" AND next_cell == (COLUMN_COUNT - 1), "left",
    direction == "left" AND next_cell == "0", "right",
    true(), direction)
| eval next_cell = if(direction == "right", current_cell + 1, current_cell - 1)
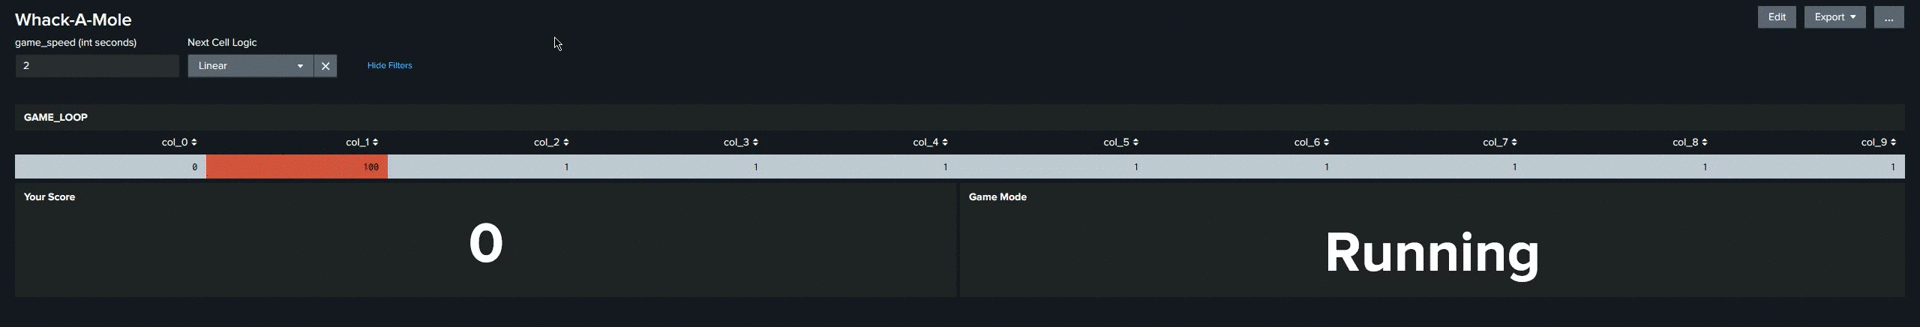
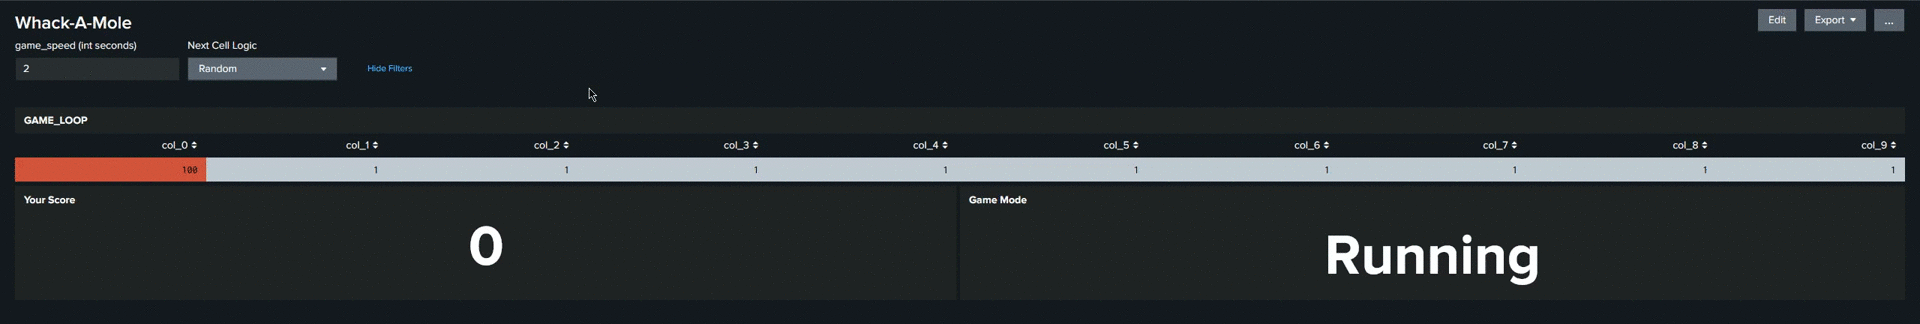
That works, but it’s not very exciting. What would be a little more fun would be to randomise the next cell, so that things aren’t quite so predictable. And really, por qué no los dos? We can add this as a drop-down input to let the next-cell logic be changed mid-game, through the depends system we talked about earlier.
| eval next_cell = random() % COLUMN_COUNT
I would call this a functional game at this stage – but we can go further!
Taking Things to the Next Dimension
2D, baby! If we turn our tape into a grid, the difficulty would ramp up significantly. So voilà:
Reminds me of those aim practice maps that were popular in Counter Strike a few years ago. This actually takes fewer changes than you might have expected; only two panels need to change. First, the initialiser needs to create a 2-D grid rather than a 1-D one, which can be done simply with another variable and mvexpand:
| eval x = mvrange(0, COLUMN_COUNT)
| eval x = mvmap(x, "col_" . x)
| chart sum(eval(0)) as starting_value over COLUMN_COUNT by x
| eval ROW_COUNT = "5"
| eval row = mvrange(0, ROW_COUNT)
| mvexpand row
And the core loop needs to have two random variables, and a way to set only a single cell to the new value. If you did a naive eval col_1 = "100", that would change every row within that column, so the foreach loop checks both the row and column before updating the value.
| eval next_cell_row =  (random() % ROW_COUNT)
| eval next_cell_col = (random() % COLUMN_COUNT)
| eventstats first(next_cell_row) as next_cell_row, first(next_cell_col) as next_cell_col
| foreach col_*
    [| eval <<FIELD>> = if(row == next_cell_row AND replace("<<FIELD>>", "^.*(\d+)$", "\1") == next_cell_col, "100", "0")]
That’s where I’ll leave things for now. Maybe this sparks some ideas for you on how you could use similar techniques in a more... realistic use case for Splunk.
Addendum
If you’re interested, the full dashboard code to run both the 1D and 2D versions of this are available in the GitHub repo if you’d like to peruse. You don’t need any other dependencies to run them, and the initialiser panel will set up the lookups required behind the scenes on the first run automatically.
On a final note, in making this, I found a great little one-liner on superuser to convert MP4s and make the gifs in this post without horrendous compression like the online tools, so for my own future reference:
ffmpeg -i linear_cropped.mp4 -vf scale=1920:-1 -r 10 -f image2pipe -vcodec ppm - | convert -delay 10 -loop 0 - gif:- | convert -layers Optimize - linear_cropped.gif